Trace Gas Measurement Campaign at Hohenpeissenberg
Published: 7, December, 2022
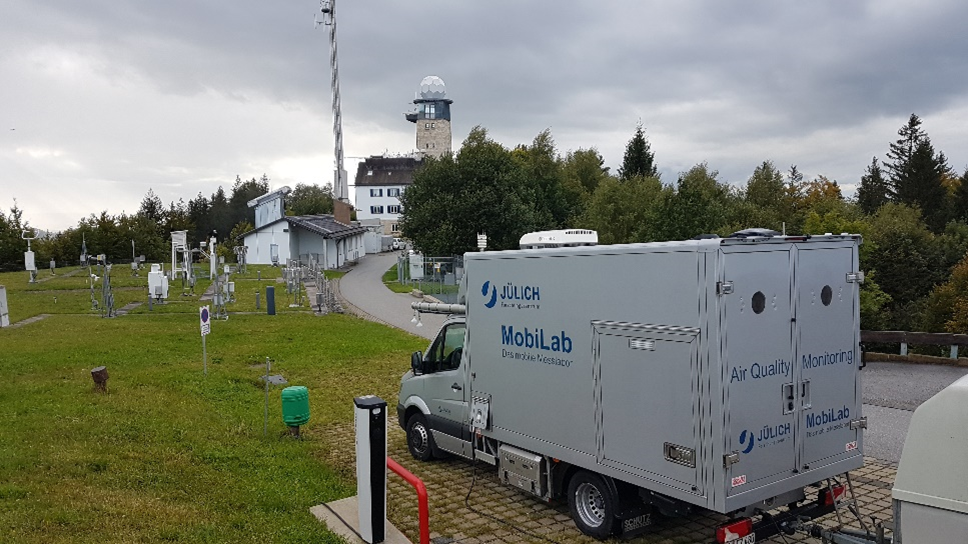
The Meteorological Observatory Hohenpeissenberg operated by the German Meteorological Service (DWD) is a global GAW site and an ACTRIS national facility with a long-term record of trace gas observations. From September 14 to 28, researchers from the Central Facility for Reactive Gases in Situ (CiGas) at Forschungszentrum Jülich (FZJ, Germany) and DWD conducted a measurement campaign with a focus on ozone precursors. FZJ contributed with additional measurements from its mobile laboratory (MobiLab) including a tunable diode laser spectrometer to measure, e.g., HONO as an important radical source.
The first preliminary results show a good agreement between the NO2 and NO observations detected with the tunable diode laser spectrometer (MIRO) and the Iterative Cavity-Enhanced DOAS instrument (ICAD) of FZJ.
The dataset of reactive gases observed by DWD at Hohenpeissenberg (NOx, OH reactivity, O3, CO, SO2, anthropogenic and biogenic VOCs) is currently being processed. The preliminary data set for VOCs shows low levels of monoterpenes typical for the beginning of autumn and surface ozone levels between 30 and 50 nmol/mol. The results of the campaign will be analyzed as part of the TOAR-II (Tropospheric Ozone Assessment Report) on ozone formation in Central Europe.
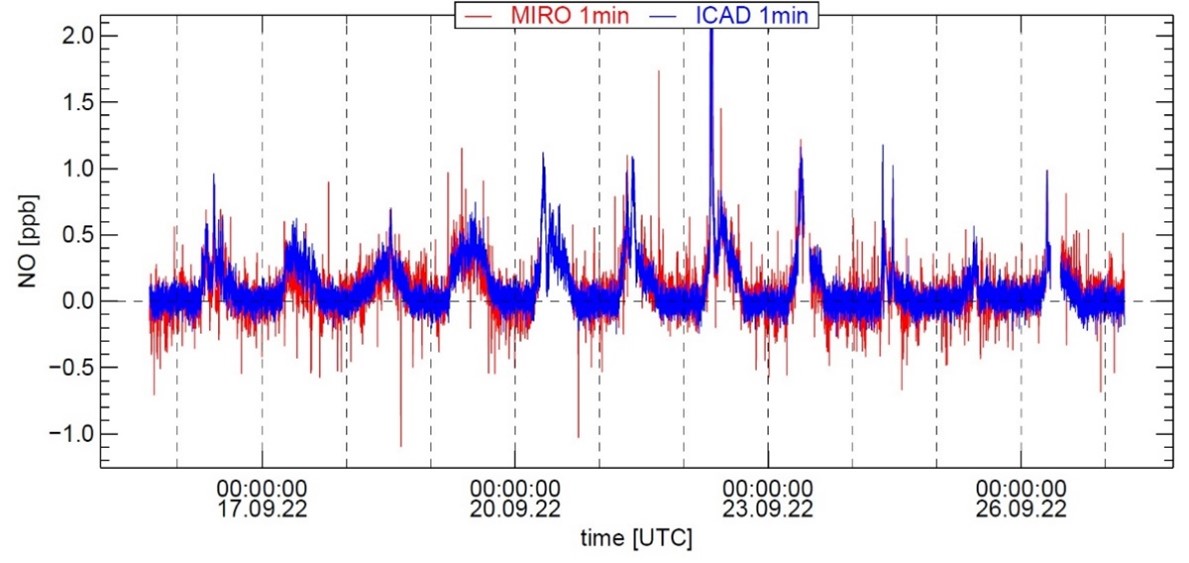
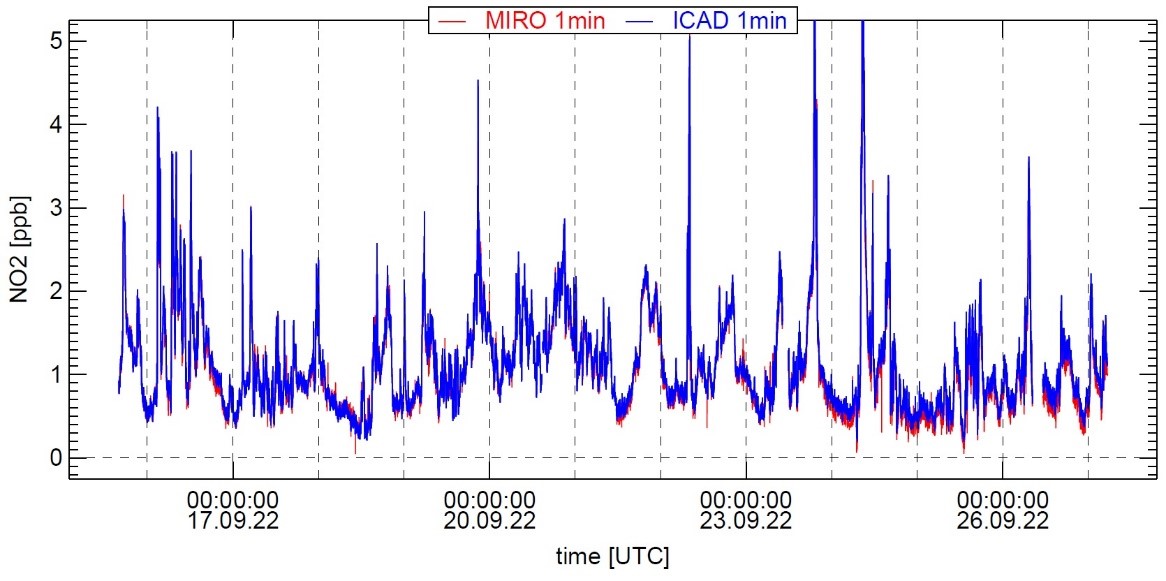
Time series for NO and NO2 at Hohenpeissenberg observed with the tunable diode laser spectrometer (MIRO, in red) and the Iterative Cavity-Enhanced DOAS instrument (ICAD, in blue) of FZJ.
Time series of the amount fractions of isoprene and some of the monoterpenes observed at Hohenpeissenberg with the GC-MS/FID system, with their associated uncertainties. The GC-MS/FID system had to be shut down for the second week of the campaign due to a column break within the instrument. Additionally, the observed temperature and the preliminary ozone time series are shown. The amount fraction of a- and b-pinene is plotted on the secondary (right) axis.